Flame Graph
Introduction
Flame graphs are a visualization of profiled software, allowing the most frequent code-paths to be identified quickly and accurately. They can be generated using open source programs on github.com/brendangregg/FlameGraph, which create interactive SVGs.
Example Usage
Following is step-by-step instruction using seti as example:
- Install systemtap and clone nginx-systemtap-toolkit:
apt-get install -y linux-tools-`uname -r` git systemtap git clone --depth 1 https://github.com/wxdublin/nginx-systemtap-toolkit.git - Get FlameGraph:
git clone --depth 1 https://github.com/brendangregg/FlameGraph.git - Install kernel symbol
- Install bonic and seti:
apt-get install boinc-app-seti-dbg - create a SETI@home account and copy account key.
boinccmd --project_attach http://setiathome.berkeley.edu <app key> - Generate On-CPU user space flare graph:
cd ~/nginx-systemtap-toolkit ./sample-bt -p `pgrep seti | head -n 1` -t 5 -u > on.user c++filt < on.user | ~/FlameGraph/stackcollapse-stap.pl | ~/FlameGraph/flamegraph.pl > on.user.svg - Generate On-CPU kernel space flare graph:
./sample-bt -p `pgrep seti | head -n 1` -t 5 -k > on.kern c++filt < on.kern | ~/FlameGraph/stackcollapse-stap.pl | ~/FlameGraph/flamegraph.pl > on.kern.svg - Off-CPU User Flare Graph:
cd ~/nginx-systemtap-toolkit ./sample-bt-off-cpu -p `pgrep seti | head -n 1` -t 5 -u > off.user c++filt < off.user | ~/FlameGraph/stackcollapse-stap.pl | ~/FlameGraph/flamegraph.pl > off.user.svg - On-CPU Kernel flare graph:
./sample-bt-off-cpu -p `pgrep seti | head -n 1` -t 5 -k > off.kern
c++filt < off.kern  | ~/FlameGraph/stackcollapse-stap.pl | ~/FlameGraph/flamegraph.pl > off.kern.svg
Analyze
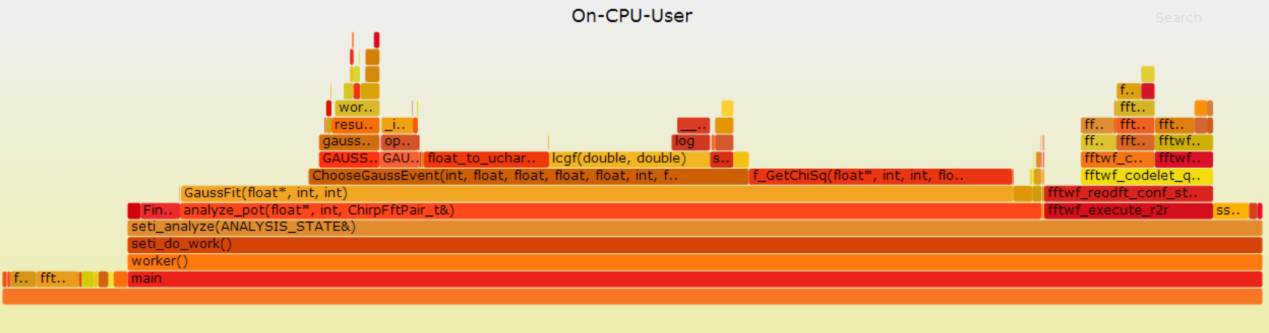
In user level On-CPU graph, the top edges of boxes tells us who's running on CPU. Function seti_analyze is main user, and to be more specific its children functions 1) math algorithms: lcgf, float_to_uchar, f_getChiSq; 2) Memory related: GAUSS_INFO::GAUSS_INFO and GAUSS::!GAUSS_INGO.
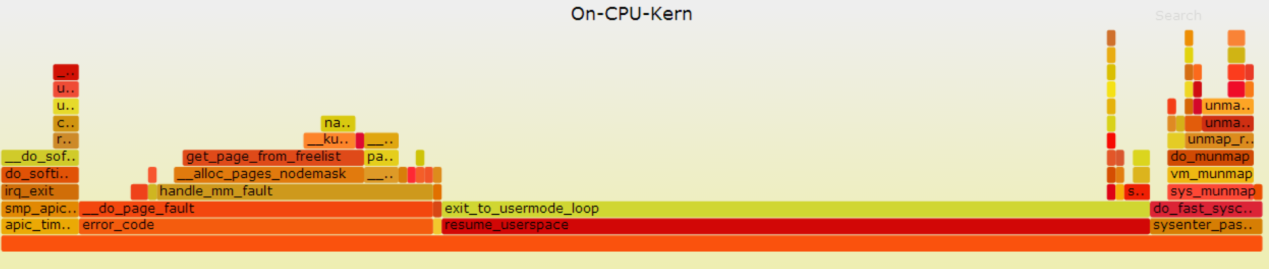 Kernel level On-CPU graph clearly say kernel only does four things: timer management, memory allocation, user/kernel switch and memory free.
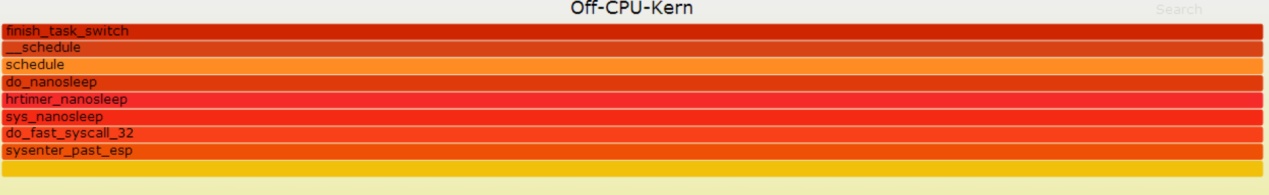 Kernel level Off-CPU graph just tells us the kernel is doing lots of scheduling.
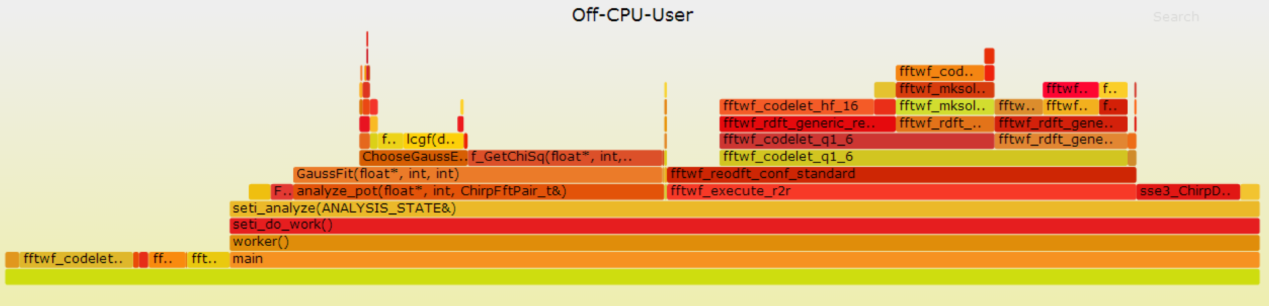 User level Off-CPU graph is the most difficult to understand. What caused the app off the CPU is not cleat at all. The root cause is I only did the user level tracing. To enable both kernel and user (like perf), I did:
On-CPU Kernel/User:
./sample-bt-off-cpu -p
User level Off-CPU graph is the most difficult to understand. What caused the app off the CPU is not cleat at all. The root cause is I only did the user level tracing. To enable both kernel and user (like perf), I did:
On-CPU Kernel/User:
./sample-bt-off-cpu -p pgrep seti | head -n 1 -t 5 -k -u> off.all
c++filt < off.all | ~/FlameGraph/stackcollapse-stap.pl | ~/FlameGraph/flamegraph.pl > off.all.svg
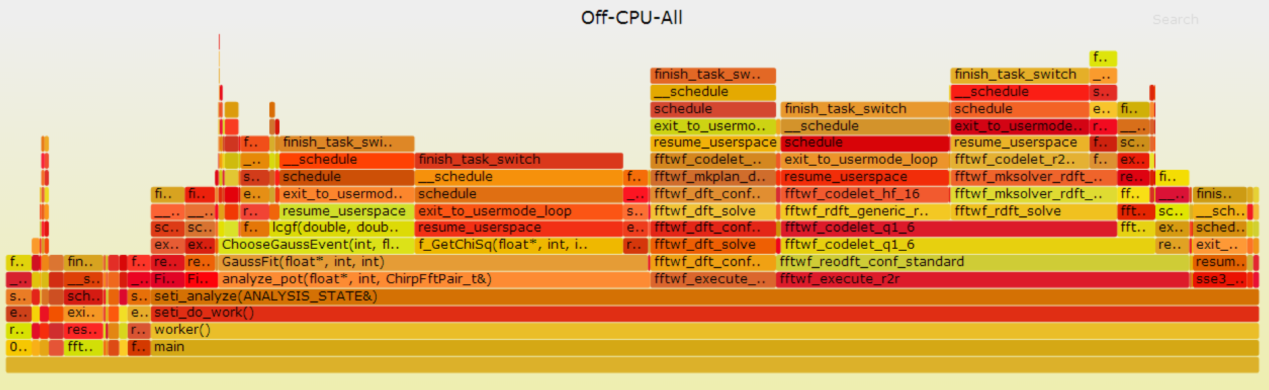
From above we can understand well - the app invoke some syscall, and on the return, resume_userspace is called and because of timeslice already used up, another thread(process) is scheduled and so the app is in off-cpu state.