The Linux Scheduler: a Decade of Wasted Cores
Scheduler History
The Linux scheduler has gone through a couple ma- jor redesigns. The original scheduler had high algorithmic complexity, which resulted in poor performance when highly multithreaded workloads became common.
In 2001, it was replaced by a new scheduler with O(1) complexity and better scalability on SMP systems. It was initially successful but soon required modifications for new architectures like NUMA and SMT. At the same time, users wanted better support for desktop use cases such as interactive and audio applications which required more changes to the scheduler.
Despite numerous modifications and proposed heuristics, the O(1) scheduler was not able to meet expectations and was replaced by CFS in 2007. Interestingly, CFS sacrifices O(1) complexity for O(log n) but it was deemed worthwhile to provide the desired features.
As the hardware and workloads became more complex, CFS too succumbed to bugs. The addition of autogroups coupled with the hierarchical load balancing introduced the Group Imbalance bug. Asymmetry in new, increasingly more complex NUMA systems triggered the Scheduling Group Construction bug. “NUMA-ness” of modern sys- tems was responsible for the Missing Scheduling Domains bug. Cache-coherency overheads on modern multi-node ma- chines motivated the cache locality optimization that caused the Overload-on-Wakeup bug.
The recently-released Linux 4.3 kernel features a new implementation of the load metric. This change is reported to be “done in a way that significantly reduces complexity of the code” [5]. Simplifying the load metric could get rid of the Group Imbalance bug, which is directly related to it. However, we confirmed, using our tools, that the bug is still present.
Catching these bugs with testing or conventional perfor- mance monitoring tools is tricky. They do not cause the system to crash or to run out of memory, they silently eat away at performance. As we have seen with the Group Im- balance and the Overload-on-Wakeup bugs, they introduce short-term idle periods that “move around” between dif- ferent cores. These microscopic idle periods cannot be no- ticed with performance monitoring tools like htop, sar or perf. Standard performance regression testing is also un- likely to catch these bugs, as they occur in very specific situa- tions (e.g., multiple applications with different thread counts launched from distinct ttys). In practice, performance test- ing on Linux is done with only one application running at a time on a dedicated machine – this is the standard way of limiting factors that could explain performance differences.
Factors:
- MT
- Architectire
- NUMA
- SMT
- Interactive
Overview
Classical scheduling problems revolve around setting the length of the scheduling quantum to provide interactive re- sponsiveness while minimizing the context switch overhead, simultaneously catering to batch and interactive workloads in a single system, and efficiently managing scheduler run queues. By and large, by the year 2000, operating systems designers considered scheduling to be a solved problem; the Linus Torvalds quote is an accurate reflection of the general opinion at that time.
Year 2004 brought an end to Dennard scaling, ushered in the multicore era and made energy efficiency a top concern in the design of computer systems. These events once again made schedulers interesting, but at the same time increas- ingly more complicated and often broken.
Our recent experience with the Linux scheduler revealed that the pressure to work around the challenging properties of modern hardware, such as non-uniform memory access latencies (NUMA), high costs of cache coherency and syn- chronization, and diverging CPU and memory latencies, re- sulted in a scheduler with an incredibly complex implemen- tation. As a result, the very basic function of the scheduler, which is to make sure that runnable threads use idle cores, fell through the cracks.
The main contribution of this work is the discovery and study of four performance bugs in the Linux scheduler. These bugs cause the scheduler to leave cores idle while runnable threads are waiting for their turn to run. 1 Resulting performance degradations are in the range 13-24% for typi- cal Linux workloads, and reach 138× in some corner cases. Energy waste is proportional. Since these bugs undermine a crucial kernel sub-system, cause substantial, sometimes massive, degradation of performance, and evade conven- tional testing and debugging techniques, understanding their nature and provenance is important.
These bugs have different root causes, but a common symptom. The scheduler unintentionally and for a long time leaves cores idle while there are runnable threads waiting in runqueues. Short-term occurrences of this condi- tion are acceptable: the system may temporarily enter such a state when, for instance, a thread exits or blocks or when a thread is created or becomes unblocked. Long-term occur- rences are not an expected behavior. The Linux scheduler is work-conserving, meaning that it should never leave cores idle if there is work to do. Long-term presence of this symp- tom is, therefore, unintentional: it is due to bugs and it hurts performance.
We provide fixes to these bugs, and observe substan- tial performance improvements. Synchronization-intensive applications experienced many-fold speedups; one barrier- heavy scientific application ended up running 138 times faster. Kernel make and a TPC-H workload on a widely used commercial DBMS improved performance by 13% and 14% respectively. The TPC-H query most affected by the bug sped up by 23%.
Detecting these bugs is difficult. They do not cause the system to crash or hang, but eat away at performance, often in ways that are difficult to notice with standard performance monitoring tools. With the TPC-H workload, for example, the symptom occurred many times throughout the execution, but each time it lasted only a few hundreds of milliseconds – too short to detect with tools like htop, sar or perf. Yet, collectively these occurrences did enough damage to slow down the most affected query by 23%. Even in cases where the symptom was present for a much longer duration, the root cause was difficult to discover, because it was a result of many asynchronous events in the scheduler.
Sanity Checker
We initially suspected scheduler bugs when we observed unexplained performance in the TPC-H database workload, which we were evaluating for a different project. Conven- tional tools were unhelpful to us in either confirming the bugs or understanding their root causes. To that end, we de- signed two new tools. The first tool, which we call a sanity checker, periodically checks for the violation of the afore- mentioned invariant, catches the bugs on a live system and collects a trace with relevant information for offline analy- sis. The second tool visualizes traces of scheduling activity to expedite debugging. These tools were easy to port be- tween kernel versions (from Linux 3.17 through 4.3), ran with negligible overhead and consistently detected invariant violations. Keeping them in the standard tool belt can help reduce future occurrence of this class of bugs.
CFS Bugs
With so many rules about when the load balancing does or does not occur, it becomes difficult to reason about how long an idle core would remain idle if there is work to do and how long a task might stay in a runqueue waiting for its turn to run when there are idle cores in the system. Since there are very few developers who “create the perfect code the first time around”, this complexity leads to bugs. Understanding the bugs is necessary to appreciate why they evade conventional testing and debugging tools. Therefore, we describe the bugs first and delay the presentation of the tools that we used to confirm and understand them until Section 4. Table 4 summarizes the bugs described in this section.
The Group Imbalance bug
The bug.
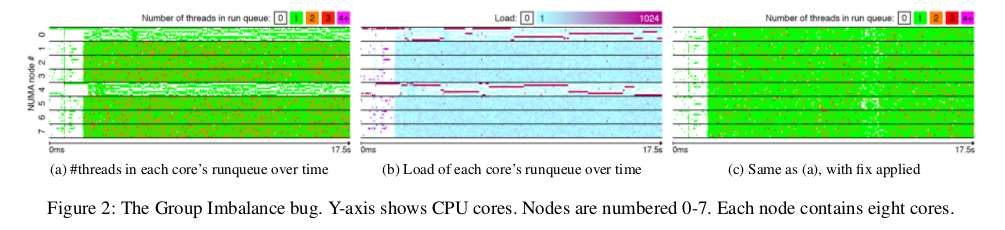
We encountered this bug on a multi-user machine which we used to perform kernel compilation and data anal- ysis using the R machine learning package. We suspected that this system, a 64-core, eight-node NUMA server, did not use all available cores for highly-threaded computations, instead crowding all threads on a few nodes. We illustrate this bug with the output from our visual tool, shown on Fig- ures 2a and 2b.
In the time period shown in the figure, the machine
was executing a compilation of the kernel (make with 64 threads), and running two R processes (each with one
thread). The make and the two R processes were launched
from 3 different ssh connections (i.e., 3 different ttys).
Figure 2a is a heatmap colour-coding the number of threads
in each core’s runqueue over time. The warmer the colour,
the more threads a core hosts; white corresponds to an idle
core. The chart shows that there are two nodes whose cores
run either only one thread or no threads at all, while the rest
of the nodes are overloaded, with many of the cores having
two threads in their runqueue.
After investigation, we found that the scheduler is not balancing load because of (i) the complexity of the load- tracking metric, and (ii) the hierarchical design. Let us first focus on the load. Remember that a threads’ load is a com- bination of its weight and how much CPU it needs. With autogroups, the thread’s load is also divided by the num- ber of threads in the parent autogroup. In our case, a thread in the 64-thread make process has a load roughly 64 times smaller than a thread in a single-threaded R process.
Discrepancies between threads’ loads are illustrated in Figure 2b, which shows the combined load of threads in each core’s runqueue: a darker colour corresponds to a higher load. Nodes 0 and 4, the ones running the R processes, each have one core with a very high load. These are the cores that run the R threads. The Linux load balancer steals work from other runqueues based on load; obviously the underloaded cores on Nodes 0 and 4 should not steal from the overloaded core on their own node, because that core runs only a single thread. However, they must be able to steal from the more loaded cores on other nodes. Why is this not the case?
Remember that to limit algorithmic complexity, the load balancing algorithm uses a hierarchical design. When a core attempts to steal work from another node, or, in other words, from another scheduling group, it does not examine the load of every core in that group, it only looks at the group’s average load (line 11 of Algorithm 1). If the average load of the victim scheduling group is greater than that of its own, it will attempt to steal from that group; otherwise it will not. This is the exact reason why in our situation the underloaded cores fail to steal from the overloaded cores on other nodes. They observe that the average load of the victim node’s scheduling group is not any greater than their own. The core trying to steal work runs on the same node as the high-load R thread; that thread skews up the average load for that node and conceals the fact that some cores are actually idle. At the same time, cores on the victim node, with roughly the same average load, have lots of waiting threads.
A valid question to ask is whether work stealing should occur in this case, since theoretically we want threads with a higher load to get more CPU time than threads with a lower load. The answer to that question is “yes”: the Linux CFS scheduler is work-conserving in nature, so threads may get more than their fair share of CPU cycles if there are idle cores in the system; in other words, idle cores should be always given to waiting threads. As we have seen in the scenario illustrated here, this is not necessarily the case.
The Fix
To fix the bug, we changed the part of the algo- rithm that compares the load of scheduling groups. Instead of comparing the average loads, we compare the minimum loads (lines 11 and 15 of Algorithm 1). The minimum load is the load of the least loaded core in that group. If the min- imum load of one scheduling group is lower than the mini- mum load of another scheduling group, it means that the first scheduling group has a core that is less loaded than all cores in the other group, and thus a core in the first group must steal from the second group. This algorithm ensures that no core of the second group will remain overloaded while a core of the first group has a smaller load, thus balancing the load across cores. Note that this fix works, because load is also balanced inside the groups (because of load balancing calls at lower levels of the hierarchy). Just as the original algo- rithm, we use the special cases of group imbalance (line 13 of Algorithm 1) to deal with corner cases due to tasksets. These modifications add no algorithmic complexity to the scheduler as computing the minimum load of a scheduling group and its average have the same cost. In our experience, this fix does not result in an increased number of migrations between scheduling groups (ping-pong effect).
Impact on performance.
Figure 2c is a trace of the execution of that workload with the fix applied (showing a heatmap of runqueue sizes, in the same fashion as Figure 2a). After we fixed the bug, the completion time of the make job, in the make/R workload described earlier in this section, decreased by 13%. The completion time of the two R processes did not change. Performance impact could be much higher in other circumstances. For example, in a workload running lu from the NAS benchmark 3 with 60 threads, and four single threaded R processes, lu ran 13× faster after fixing the Group Imbalance bug. lu experienced a super-linear speedup, because the bug exacerbated lock contention when multiple lu threads ran on the same core.
The Scheduling Group Construction bug
The Bug
Linux defines a command, called taskset, that
enables pinning applications to run on a subset of the avail-
able cores. The bug we describe in this section occurs when
an application is pinned on nodes that are two hops apart.
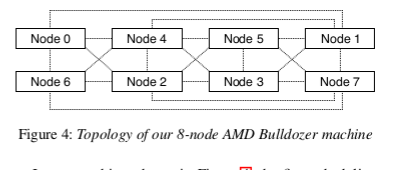
For example, in Figure 4, which demonstrates the topology
of our NUMA machine, Nodes 1 and 2 are two hops apart.
The bug will prevent the load balancing algorithm from mi-
grating threads between these two nodes. Since threads are
created on the same node as their parent thread, the net ef-
fect is that the pinned application runs only on one node, no
matter how many threads it has.
 The bug is due to the way scheduling groups are con-
structed, which is not adapted to modern NUMA machines
such as the one we use in our experiments. In brief, the
groups are constructed from the perspective of a specific core
(Core 0), whereas they should be constructed from the per-
spective of the core responsible for load balancing on each
node. We explain with an example.
The bug is due to the way scheduling groups are con-
structed, which is not adapted to modern NUMA machines
such as the one we use in our experiments. In brief, the
groups are constructed from the perspective of a specific core
(Core 0), whereas they should be constructed from the per-
spective of the core responsible for load balancing on each
node. We explain with an example.
In our machine, shown in Figure 4, the first scheduling group contains the cores of Node 0, plus the cores of all the nodes that are one hop apart from Node 0, namely Nodes 1, 2, 4 and 6. The second scheduling group contains the cores of the first node not included into the first group (Node 3), plus cores of all nodes that are one hop apart from Node 3: Nodes 1, 2, 4, 5, 7. The first two scheduling groups are thus:
{0, 1, 2, 4, 6}, {1, 2, 3, 4, 5, 7}
Note that Nodes 1 and 2 are included in both scheduling groups. Further note that these two nodes are actually two hops apart from one another. If the scheduling groups were constructed from the perspective of Node 1, Node 1 and 2 would not be together in all groups. Let us see what this implies for load balancing.
Suppose that an application is pinned on Nodes 1 and 2 and that all of its threads are being created on Node 1 (Linux spawns threads on the same core as their parent thread; when an application spawns multiple threads during its initialization phase, they are likely to be created on the same core – so this is what typically happens). Eventually we would like the load to be balanced between Nodes 1 and
- However, when a core on Node 2 looks for work to steal, it will compare the load between the two scheduling groups shown earlier. Since each scheduling group contains both Nodes 1 and 2, the average loads will be the same, so Node 2 will not steal any work!
The bug originates from an attempt to improve the per- formance of Linux on large NUMA systems. Before the in- troduction of the bug, Linux would balance the load inside NUMA nodes and then across all NUMA nodes. New lev- els of hierarchy (nodes 1 hop apart, nodes 2 hops apart, etc.) were introduced to increase the likelihood for threads to re- main close to their original NUMA node.
The fix.
We modified the construction of scheduling groups so that each core uses scheduling groups constructed from its perspective. After the fix, when cores of Node 1 and 2 try to steal tasks at the level of the machine, Nodes 1 and 2 are no longer included in all scheduling groups. The cores are thus able to detect an imbalance and to steal work.
Impact on performance.
Table 1 presents the perfor-
mance difference in NAS applications with and without
the Scheduling Group Construction bug. Applications are
launched on two nodes with as many threads as there are
cores. The maximum slowdown of 27× is experienced by
lu. The slowdown is a lot more than the expected 2× be-
cause of locking effects. NAS applications use spinlocks and
spin-barriers; when all threads execute on the same node
due to the taskset bug, the thread that executes the critical
section may be descheduled in favour of a thread that will
waste its timeslice by spinning. lu is an extreme example of
this: it uses a pipeline algorithm to parallelize work; threads
wait for the data processed by other threads. When multiple
threads are forced to execute on the same core, this results
in large performance losses [22].

The Overload-on-Wakeup bug
The bug.
The gist of this bug is that a thread that was asleep may wake up on an overloaded core while other cores in the system are idle. The bug was introduced by an optimization in the wakeup code (select task rq fair function). When a thread goes to sleep on Node X and the thread that wakes it up later is running on that same node, the scheduler only considers the cores of Node X for scheduling the awakened thread. If all cores of Node X are busy, the thread will wake up on an already busy core and miss opportunities to use idle cores on other nodes. This can lead to a significant under-utilization of the machine, especially on workloads where threads frequently wait.
The rationale behind this optimization is to maximize cache reuse. Essentially, the scheduler attempts to place the woken up thread physically close to the waker thread, e.g., so both run on cores sharing a last-level cache, in consideration of producer-consumer workloads where the woken up thread will consume the data produced by the waker thread. This seems like a reasonable idea, but for some workloads waiting in the runqueue for the sake of better cache reuse does not pay off.
This bug was triggered by a widely used commercial database configured with 64 worker threads (1 thread per core) and executing the TPC-H workload. This workload, in combination with transient short-lived threads from other applications, triggers both the Group Imbalance bug 4 and the Overload-on-Wakeup bug. Since we already described the Group Imbalance bug in Section 3.1, we disabled auto- groups in this experiment in order to better illustrate the Overload-on-Wakeup bug.
Figure 3 illustrates several instances of the wakeup bug. During the first time period (noted ❶), one core is idle while a thread that ideally should be scheduled on that core keeps waking up on other cores, which are busy. During the second time period (noted ❷), there is a triple instance of the bug: three cores are idle for a long time, while three extra threads that should be scheduled on those cores keep waking up on other busy cores.
The Missing Scheduling Domains bug
The bug.
When a core is disabled and then re-enabled us- ing the /proc interface, load balancing between any NUMA nodes is no longer performed. The bug is due to an incor- rect update of a global variable representing the number of scheduling domains in the machine. When a core is disabled, this variable is set to the number of domains inside a NUMA node. As a consequence, the main scheduling loop (line 1 of Algorithm 1) exits earlier than expected.
As a result, threads can only run on the node on which they ran before the core had been disabled (even if the node they run on is not the same as that on which the core was disabled and then re-enabled). For processes created after disabling the core, all threads will run on the same node as their parent process. Since all processes are usually created from the same “root” process (e.g., sshd daemon and the ssh processes it spawns), this bug usually results in all newly created threads executing on only one node of the machine, regardless of the number of threads.
Tools
Tracing.
Due to the complexity of some of the bugs we en- countered, the Overload-on-Wakeup bug in particular, profil- ing tools were not sufficient to fully understand their causes: we needed traces in order to precisely follow the behavior of the scheduler.
Many tracing tools have been proposed to help detect performance bugs. Event Tracing for Windows [2] and DTrace [1] are frameworks that make it possible to trace application and kernel events, including some scheduler events, for the Microsoft Windows, Solaris, MacOS X and FreeBSD operating systems. The Linux kernel comes with its own set of tracers, such as Ftrace [3] and SystemTap [6]. Some additional tools such as KernelShark [4] produce graphical traces.
Our online sanity checker does not provide a novel way to monitor events, and directly relies on SystemTap for this purpose. What our sanity checker does that is not included in these tools, however, is detecting an invariant violation in order to only monitor events while a performance bug is occur- ring: running existing tracing tools all the time would be of little use to detect performance bugs, since they would pro- duce large amounts of data that would overwhelmingly con- sist of non-buggy execution traces, with no way to jump to the buggy sections of these traces. Moreover, our visualiza- tion tool is capable of monitoring very fine-grained sched- uler events that were crucial to understanding some of the performance bugs presented in this paper, such as individ- ual scheduling events (which makes it possible to plot which scheduling event was responsible each time a thread moves across cores), or individual iterations in the work-stealing loop (which makes it possible to monitor which cores are considered during load balancing).